21.DataCollection
21.1DataCollection
- Definition
JavaScript data object allocated to the browser memory.
DataCollection is a data model that WebSquare5 uses for easier control of a large-volume data on the web browser.
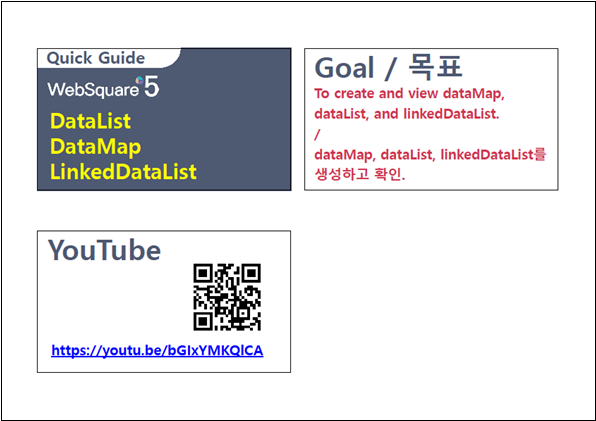
- Types
DataMap: Single set of data
DataList: Multiple sets of data
LinkedDataList: Filtered/Sorted DataList
Model | Description |
|---|---|
dataMap | Single set of data object in the key/value form |
dataList | Multiple sets of data object to contain list-type data |
linkedDataList | Filtered/Sorted DataList |
- Functions
Defines the data form to be sent to the server. (Reference)
Defines the data form to be received from the server. (Target)
- Major Usage
Temporary data to be displayed on the UI
Interfaces with the UI components.
Receives single set of data (DataMap) or list-type data (DataList) received from the server and displays them on the browser.
Provides interfaces to add, delete, or edit the data stored on the remote server through the web browser.
- Features
DataCollection provides intuitive interfaces for the users to understand the data structure without knowledge in XML and XPath.
The codes of the DataCollection defined in the DataCollection view are automatically generated on the Source code tab.
ID of each data object is mandatory.
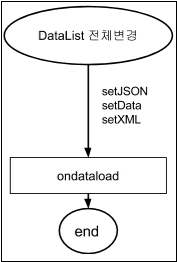
Can set or get in JSON, XML, or JSON array formats. (LinkedDataList cannot be set. It can only be get.)
Default values can be defined. (Not LinkedDataList.)
Can be dynamically created by script.
Manages the data status (add, modify, delete).
Download from the Internet or
View in WEBSQUARE_DEV_PACK (/_DataCollection/dataList_dataMap_linkedDataList.xml)
Figure 21-1.YouTube Video (https://youtu.be/bGIxYMKQlCA)
21.2DataMapDataMap
The following is an example of the source code of the DataMap created on the DataCollection View. According to the created DataCollection, the source code is automatically created on the Source tab. The following example contains key/value-type data and has only a single set of data which is "Name/Hong, Address/Seoul Guro, E-mail/user2@mail.com".
Code 21-1.DataMap
<head>
<xf:model>
  <w2:dataCollection baseNode="map">
    <w2:dataMap id="dataMap1" baseNode="userInfo">
      <w2:keyInfo>
        <w2:key id="name" name="Name" dataType="text"/>
        <w2:key id="addr" name="Address" dataType="text"/>
        <w2:key id="email" name="E-mail" dataType="text"/>
      </w2:keyInfo>
      <w2:data use="true">
        <name>Hong</name>
        <addr>Seoul Guro</addr>
        <email>user2@mail.com</email>
      </w2:data>
    </w2:dataMap>
  </w2:dataCollection>
</xf:model>
</head>Child Nodes | Description | ||
|---|---|---|---|
<w2:keyInfo> | key | ||
<w2:key> | key value | ||
id | ID Unique value get/set cannot be used. | ||
name | key name | ||
dataType | Data type (number, text, date) Default: text | ||
<w2:data> | Actual data | ||
use | true: Uses the inputted data as the default data. false: On the Design tab of the WebSquare5 Studio is displayed the inputted data. | ||
Data | Enter the value for each key. | ||
21.2.1Creating
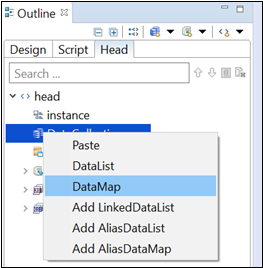
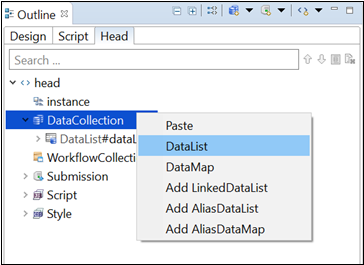
Select Outline – Head view.
Right-click DataCollection, and select DataMap.
Figure 21-2.Adding DataMap
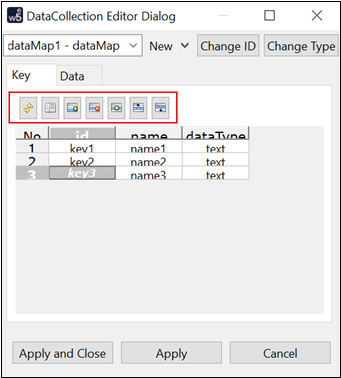
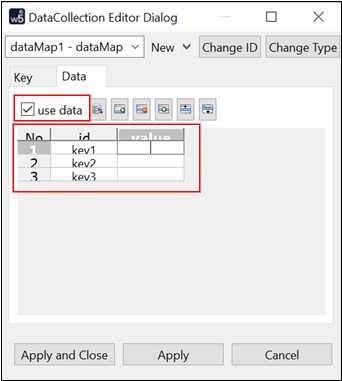
When the following window, click the row adding button and enter the data. (In case there is data already defined, copy-and-paste the data.)
Figure 21-3.Defining DataMap
When displaying the default data without submission, select the Data tab and click use data.
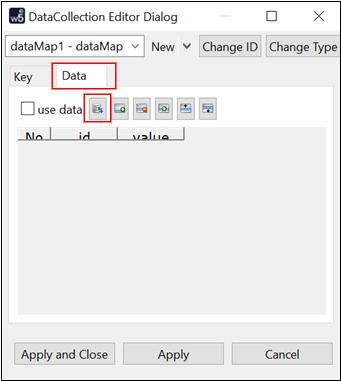
In order to display default data without submission, select use data and enter data.
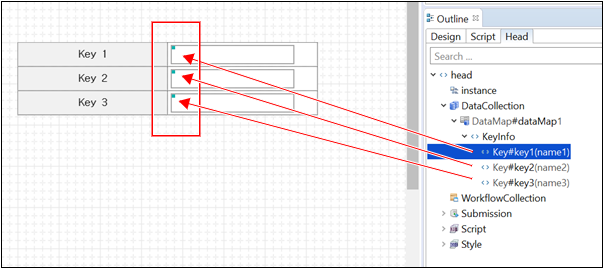
Go to the Design tab and draw UI to bind with the DataMap.
Go to Key Info. Select a key and drag-and-drop the key to the component to bind the DataMap with.
Check if a green mark is displayed on the component after being bound.
Figure 21-4.Binding
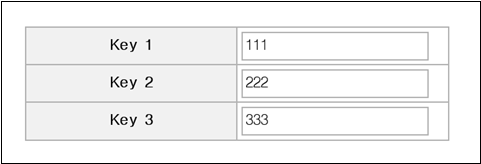
Click on Preview.
Check if the data entered above is displayed on the component.
Figure 21-5.Result
21.3DataList
The following is the source doe of the DataList created on the DataCollection view. The source code is automatically generated on the Source tab based on the created DataCollection. The following example has columns of Name, Address, and Email, and two sets of data "Hong, Seoul Guro, user2@mail.com" and "Lee, Seoul Gangnam, user2@mail.com".
Code 21-2.DataList
<head>
<xf:model>
  <w2:dataCollection baseNode="map">
    <w2:dataList id="dataList1" baseNode="vector" repeatNode="map" valueAttribute="">
      <w2:columnInfo>
        <w2:column id="name" name="Name" dataType="text" />
        <w2:column id="addr" name="Address" dataType="text" />
        <w2:column id="email" name="Email" dataType="text" />
      </w2:columnInfo>
    <w2:data use="true"  xmlns="">
    <w2:row>
      <name>Hong</name>
      <addr>Seoul Guro</addr>
      <email>user1@mail.com</email>
    </w2:row>
    <w2:row>
      <name>Lee</name>
      <addr>Seoul Gangnam</addr>
      <email>user2@mail.com</email>
    </w2:row>
    </w2:data>
    </w2:dataList>
  </w2:dataCollection>
</xf:model>
</head>Child Nodes | Description | ||
|---|---|---|---|
<w2:columnInfo> | Column info | ||
<w2:column> | Column info | ||
id | Column ID Unique value get/set cannot be used. | ||
name | Column Name | ||
dataType | Data type (number, text, date) Default: text | ||
<w2:data> | Actual data | ||
use | true: Uses the inputted data as the default data. false: On the Design tab of the WebSquare5 Studio is displayed the inputted data. | ||
| Node to separate the repeated data | ||
Data | Sets each column. | ||
21.3.1Creating
Select Outline – Head view.
Right-click DataCollection, and select DataList.
Figure 21-6.Adding DataList
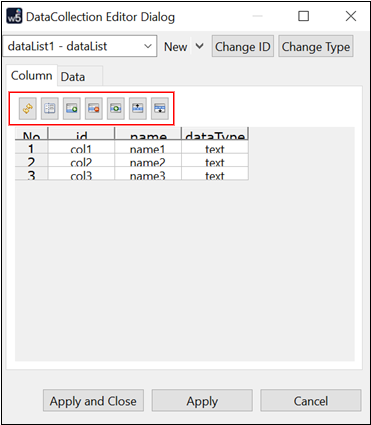
When the following window, click the row adding button and enter the data. (In case there is data already defined, copy-and-paste the data.)
Figure 21-7.Defining DataList
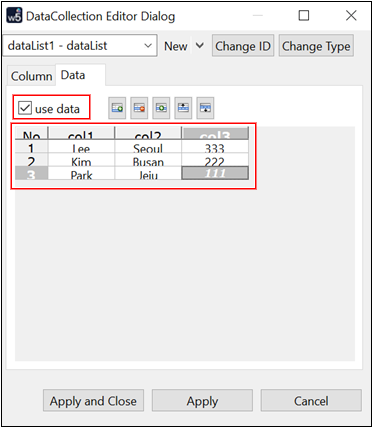
In order to display default data without submission, select the Data tab, click use data, and enter data.
Figure 21-8.Entering Data
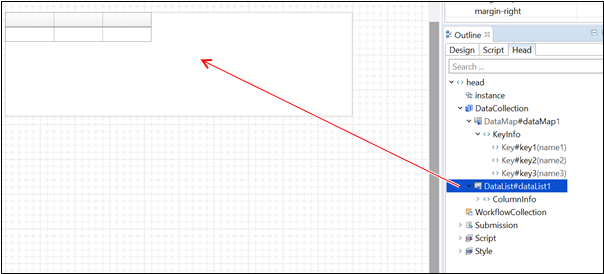
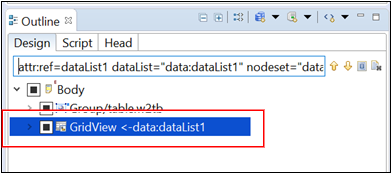
Draw a GridView on the Design tab to display the DataList data.
Select Outline – Head – DataCollection and drag-and-drop the DataList to bind with the GridView.
Figure 21-9.Dragging-and-Dropping DataList to GridView to Bind with
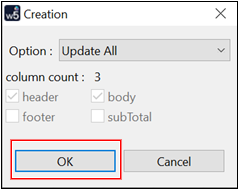
When the following window shows up, click OK.
Figure 21-10.Binding with GridView
Check the binding status through the GridView tooltip or the dataList setting of the GridView.
Figure 21-11.GridView Tooltip
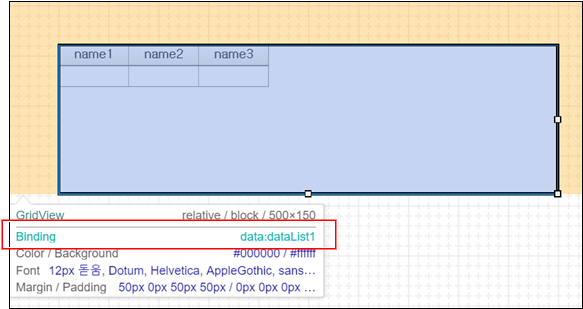
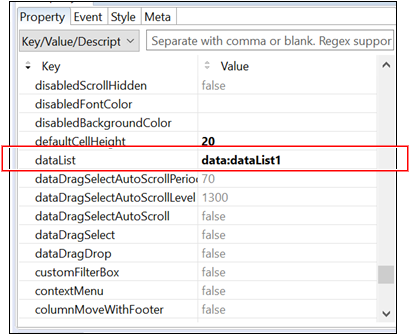
Figure 21-12.Checking dataList Setting of GridView
Or, go to Outline – Head view and click Search bound component to view the list of the components bound with the DataList.
Figure 21-13.Checking Components Bound with DataList
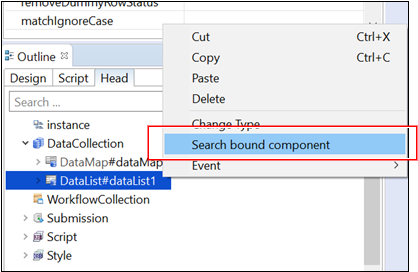
Figure 21-14.Component(s) Bound with DataList
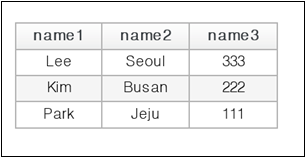
Run the page on a browser, and check if the page normally functions.
Figure 21-15.WebSquare Page on Browser
21.4LinkedDataList
The LinkedDataList contains only the sorted or filtered data of the DataList. When using the filtered data of a certain DataList as the selection items of the following components, use the LinkedDataList.
AutoComplete
CheckBox
CheckComboBox
MultiSelect
Radio
SelectBox
1,000 data is recommended for DataList while up to 10,000 data can be supported by DataList.
The LinkedDataList supports all functions of the DataList except those to add rows, add data, and remove all data.
Code 21-3.LinkedDataList Example
<head>
    <xf:model>
    <w2:dataCollection baseNode="map">
        <w2:linkedDataList id="linkedDataList1" baseNode="vector" repeatNode="map" valueAttribute="" bind="dataList1"/>
            <w2:condition type=”filter”><![CDATA[ col1 ==”1” ]]></w2:condition>
            <w2:condition type=”sort”><![CDATA[DESC('Id')]]>
</w2:condition>
    </w2:dataCollection>
</xf:model></head>
Property | Description |
|---|---|
bind | DataList storing the original data |
filterCondition | Filtering condition |
sortCondition | Sorting condition |
21.4.1Creating
Create a DataList as described earlier.
Click [Add] again.
Select [Add LinkedDataList].
Enter the sorting condition or filtering condition.
Set the newly created DataList as the
bindproperty of the LinkedDataList.Draw a component and bind the component with the LinkedDataList in the same way described earlier for the DataList.
21.4.2Sorting
- Sorting condition
Same as the DB SQL of Oracle.
- Initial Creation
Define Sort Condition upon initial creation of the LinkedDataList.
- Function
Use
setCondition().
Code 21-4.Sorting Example (1)
linkedDataList1.setCondition("sort", "ASC('col0')");Code 21-5.Sorting Example (2)
linkedDataList1.setCondition("sort","DESC(‘col0’)");Code 21-6.Sorting Example (3)
linkedDataList1.setCondition("sort","DESC(‘col0’) && DESC(‘col1’)");21.4.3Filtering
- Initial Creation
Define Filter Condition upon initial creation of the LinkedDataList.
- Function
Use
setCondition().
Code 21-7.Filtering Example
var condition = "col1>=2 && col2=='b'" ;
$p.data.create( { "id" :"linkedDataList1" ,
                     "type" : "linkedDataList" ,
                     "option" : { "baseNode" : "vactor",
                                  "repeatNode" : "list", "valueAttribute" : "",
                                  "bind" : "dataList1",
                                  "filterCondition" : condition
                                 }
} );Filter | Condition | Description |
|---|---|---|
val | Bno==val('selectbox1') | Shows only the data which are same with the value of selectBox1. |
ref | Bno == ref('data:dataList1.Bno') | Shows the data which is same as colId ‘Bno’ of dataList1. |
dafault | Bno == “1” | Shows data of which colId ‘Bno’ is 1. |
Condition | Description |
|---|---|
A == B | A and B are the same. |
A != B | A and B are not the same. |
A >= B | A is same as or larger than B. |
A <= B | A is same as or smaller than B. |
A > B | A is larger than B. |
A < B | A is smaller than B. |
(A) && (B) | A is true and B is true. |
(A) || (B) | A or B is true. |
21.4.3.1setColumnFilter()
When filtering LinkedDataList data, use setColumnFilter().
Code 21-8.Example (Filtering Only Data of Which Hobby is "Movie")
linkedDataList1.setColumnFilter({
    type: ‘row’,
    colIndex: ‘Hobby’,
    key: ‘Movie’,
    condition: ‘and’
});21.4.4Setting Filtering and Sorting Conditions
Set filtering and sorting conditions of the LinkedDataList, use setCondition().
Code 21-9.Sorting Conditions
linkedDataList1.setCondition(
    "sort", "DESC('ID')"
);
Code 21-10.Filtering Conditions
linkedDataList1.setCondition(
    "filter", "Region == 'Seoul'"
);
Video Guide – Setting sorting/filtering conditions (LinkedDataList)
Sample File
21.5Creating on Studio and Checking with Debugging Menus
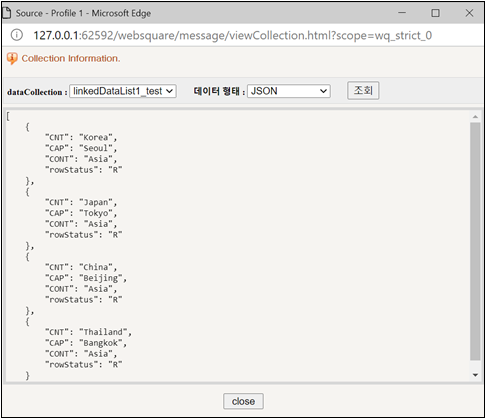
Create DataList, DataMap, and LinkedDataList on the Studio, and check them using the debugging menus provided by WebSquare5.
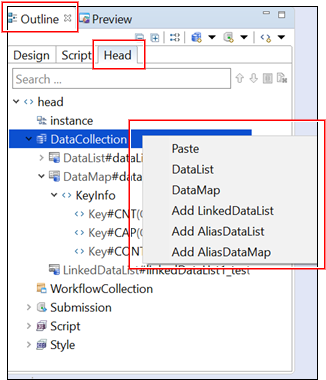
Select Outline – Head and right-click DataCollection to add DataMap, or DataList, LinkedDataList.
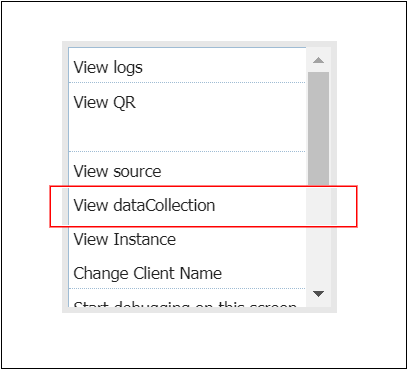
Load the page with DataMap, DataList, and LinkedDataList being created. Right-click while pressing the Ctrl button. Then, the debugging menus will be displayed as shown below. Select View dataCollection and check whether DataMap, DataList, and LinkedDataList has been successfully created.
21.6Dynamic Creation
The DataCollection can be dynamically created by $p.data.create();.
21.7Copying and Deleting
The developer can copy an existing DataCollection of a page and use the copied DataCollection in another page.
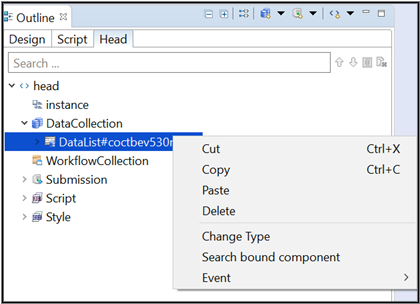
Go to Outline – Head view, select the DataCollection to copy/delete, and copy/delete it.
Figure 21-16.Outline – Head – DataCollection
21.8Major APIs
The developers who are familiar with JavaScript may easily implement following functions using the provided APIs.
Item | Functions |
|---|---|
Common | Searches and sets multiple values of the DataList and the DataMap at the same time. |
Creates and deletes the DataList and the DataMap. | |
DataMap | Returns or sets data of the specified key or index. |
Returns the entire data as a JSON object, array, or XML. | |
Generates a DataMap from JSON object, array, and XML. | |
Returns the data count. | |
DataList | Searches and inserts (single, multiple) rows. |
Searches and inserts (single, multiple) columns. | |
Searches and inserts (single, multiple) cells. | |
Sorts and filters the data. | |
Calculation (sum, average, min value, max value, etc.) |
21.8.1Downloading Multiple DataList into an Excel File
21.8.2getAllDataCollection()
Description | Returns a list of all DataCollection on the page. |
|---|---|
Format | $p.data.getAllDataCollection(); |
Return | Array that contains all DataCollection IDs. (Example: ["dataList1","dataList2"]) |
Remarks | When getAllDataCollection("object") is executed, the DataCollection object is returned as an array. |
Code 21-11.Returning ID
var ret = $p.data.getAllDataCollection();

// Returned value (Object IDs in the array)
//  ret == ["dataList1","dataList2"]
Code 21-12.Returning Object
var ret = $p.data.getAllDataCollection("object");

// Returned value (Using "object" argument will return the object itself.)
// ret == [dataList1,dataList2]21.8.3getAllJSON()
Converts the entire data of the DataList into JSON, and returns a one-dimensional array.
21.8.4getFilterList()
Returns the filtering status of each column in the DataList. The following describes how to use this function.
Format | dataList1.getFilterList(); |
|---|---|
Return | Object that stores the filters applied to the DataList as an array. |
Related Functions | setColumnFilter |
The following example is to store the current filtering status, to cancel the filtering, and to return to the filtering status.
Code 21-13.Example
<script type="text/javascript"><![CDATA[
            var data = [];
            for(var i = 0; i < 20*3 ; i++){
                data.push(i);
            }
            dataList1.setData(data);
            scwin.tempFilter = [];

    scwin.trigger1_onclick = function(e) {
        dataList1.clearFilter();
    };

    scwin.trigger2_onclick = function(e) {
        scwin.tempFilter = dataList1.getFilterList();
    };

    scwin.trigger3_onclick = function(e) {
        for(var i = 0; i < scwin.tempFilter.length; i++){
            dataList1.setColumnFilter(scwin.tempFilter[i]);
        }
    };
]]></script>21.8.5getFilteredRowIndex()
getFilteredRowIndex( realRowIndex ); is to check the new index of the row after data filtering.
21.8.6setData(), setJSON() & setXML()
In case the GridView is bound with a dataList, the developer can set the data using setData();, setJSON(); or setXML(); function.
21.8.7getRowCount()
21.8.8getCellData()
21.8.9getUserData() & setUserData()
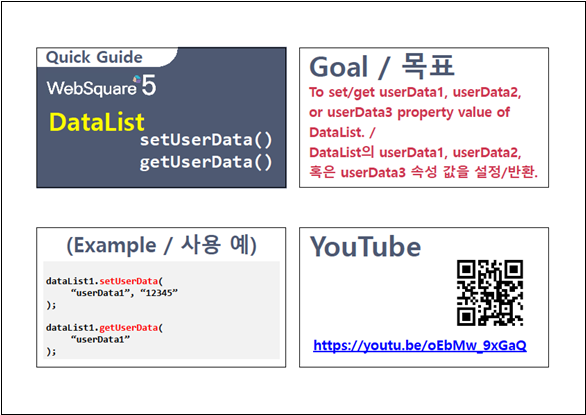
Using setUserData() and getUserData() functions, the developer can set or return userData1, userData2, or userData3 property values of a DataList. The same can be applied to all DataCollection components (including aliasDataMap, aliasDataList, aliasLinkedDataList, dataMap, and linkedDataList.)
Code 21-14.Example
dataList1.setUserData(
  “userData1”, “12345”
);

dataList1.getUserData(
  “userData1”
);
Download from the Internet or
View in WEBSQUARE_DEV_PACK (/_DataCollection/setUserData_getUserData_DataList.xml)
Figure 21-17.YouTube Video (https://youtu.be/oEbMw_9xGaQ)
21.9Adding Events
Event | Description |
|---|---|
| Triggered before the change of the cell data occurs. |
| Triggered upon a change of the cell data. Triggered upon execution of |
| Triggered before the change of the row position. |
| Triggered upon a change of the row position. |
| Triggered after insertion of a row. |
| Triggered after deletion of a row. |
| Triggered upon loading of the data. |
Figure 21-18.onbeforerowpositionchange & oncelldatachange
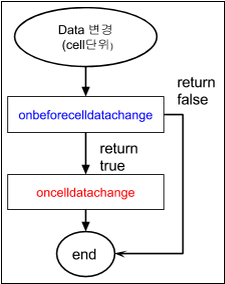
Figure 21-19.onbeforerowpositionchange & onrowpositionchange
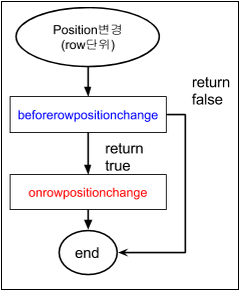
Figure 21-20.oninsertrow
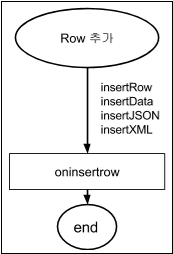
Figure 21-21.onremoverow
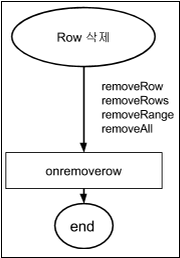
Figure 21-22.ondataload