4.Debugging
4.1Log
4.1.1Basic Logs
Using $p.log, the developer can output the basic logs.
Code 4-1.Log Example
$p.log( ":::: WebSquare ::::" );
Figure 4-1.Basic Logs
![]()
4.1.1.1Log Structure
Logs generated by $p.log() have the following format.
Code 4-2.Log Format
Time Since previous log Since initial log Log generator] Log message
Code 4-3.Log Example
06:03:13.838 00032 013248 websquare] convertTypeB
The above log is to be interpreted as shown below.
Item | Description |
|---|---|
06:03:13.838 | Log output time |
32ms | Time since the previous log |
13.248s | Time since the first log |
websquare | Log generator |
convertTypeB | Message |
4.1.2Browser Console Log
The browser must support the console object to view the browser console logs. Use the console.log method as shown below.
Code 4-4.Logs
console.log( ":::: Console Log ::::" );
Figure 4-2.Browser Console Log
![]()
IE8 or higher versions are supported.
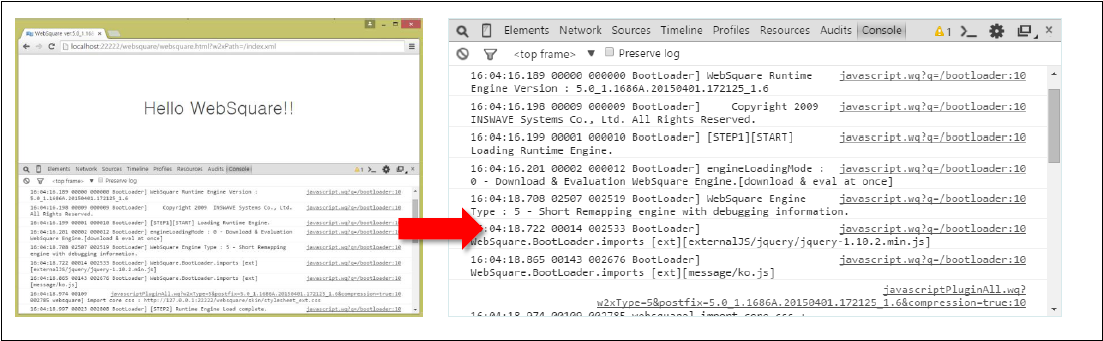
4.1.3Developer’s tool on the browser (for Chrome & IE)
Start the browser and press [F12] or choose the corresponding menu to open the developer’s tool. The following table shows major debugging menus.
Menu | Description |
|---|---|
Elements | DOM browser Shows the HTML rendered on the browser and the applied CSS. |
Console | Console. Displays WebSquare logs and console logs. |
Network | Network. Communication records between the browser and the server |
Do the following to check the logs on the browser:
Go to the following folder, and open config.xml.
Path: /WebContent/websquare/config.xml
Add the setting.
<debug value="true" remoteConsole="false" console="true"/>
Press F12 on the browser.
Run the page, and go to the Console tab.
Figure 4-3.Logs
4.1.3.1Log Types
In the config.xml file, the developer can define the log type to display on the console of the developer’s tool
Code 4-5.Logs and Errors
<WebSquare>
    <debug value=“true” console=“true”>
</WebSquare
Code 4-6.Errors Only
<WebSquare>
    <debug value=“true” errorConsole=“true”>
</WebSquare4.2Debugging Features Provided by WebSquare5
4.2.1View Logs
The script written on the WebSquare5 runs on the WebSquare5 Engine.
UI logs are not displayed through the browser warnings but are separately manged.
Check the logs in the following ways:
Run the WebSquare5 XML on a browser.
On the browser, hold the Ctrl key and right-click.
Select [View Logs].
Figure 4-4.[Ctrl + Right-clicking]

Menu | Description |
|---|---|
View Logs | Displays the script errors and the script logs. |
View DataCollection | Displays the current value of the data object. |
View Source | Displays the source code. |
Debugs the current WebSquare5 XML file. | Checks input, output, and header of the submission. |
Reset Page | Reloads the top page in SPA mode regardless of the location where the debug menu was called. |
Reset WFrame | Reloads the WFrame in which the debug menu was called in SPA mode. (Reloads the body and the script without changing the URL.) |
Figure 4-5.Logs

4.2.2View DataCollection
The developer can check the DataCollection currently bound with the component. Do the following to check the data actually allocated to the memory.
Run the WebSquare5 XML on a browser.
On the browser, hold the Ctrl key and right-click.
Select [View DataCollection].
Figure 4-6.Ctrl + Right-clicking

Figure 4-7.Current Data Binding

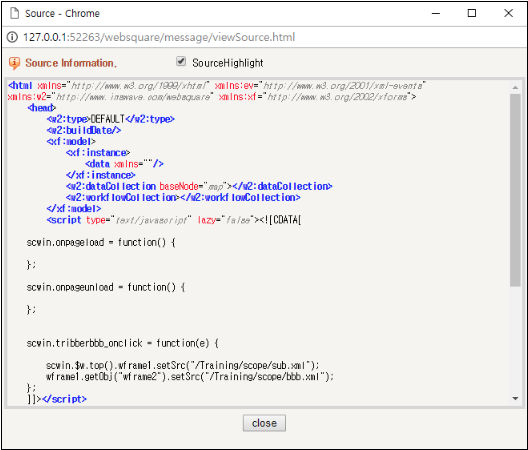
4.2.3Source Code of the Page
Run the WebSquare5 XML on a browser.
On the browser, hold the Ctrl key and right-click.
Select [View Source].

Figure 4-8.View Source